A complete overview on inflation
Inflation is a general increase in the prices of goods and services in an economy. When the general price level rises, each unit of currency buys fewer goods and services; consequently, inflation corresponds to a reduction in the purchasing power of money. The opposite of inflation is deflation, a sustained decrease in the general price level of goods and services. The common measure of inflation is the inflation rate.

What is inflation? Definition of inflation.
What inflation means?
Inflation is the term we usually use to explain rising prices of products or services, that how quickly prices go higher at particular time period is know as inflation. The general increase in prices.
Definition:
Inflation is the percentage change in the value of the Wholesale Price Index (WPI) on a year-on year basis. It effectively measures the change in the prices of a basket of goods and services in a year. In Pakistan, inflation is calculated by taking the WPI as base.
Description
Contrary to its negative effects, a moderate level of inflation characterizes a good economy. An inflation rate of 2 or 3% per year is beneficial for an economy as it encourages people to buy more and borrow more, because during times of lower inflation, the level of interest rate also remains low. Hence the government as well as the central bank always strive to achieve a limited level of inflation.
Deflation: ( opposite of inflation)
When prices decline across a sector of the economy or throughout the entire economy, it’s called deflation. While it might seem nice that you can buy more for less tomorrow, economists warn that deflation can be even more dangerous for an economy than unchecked inflation.Types of inflation
Inflation is broadly categorized into 3 types that are discussed below:
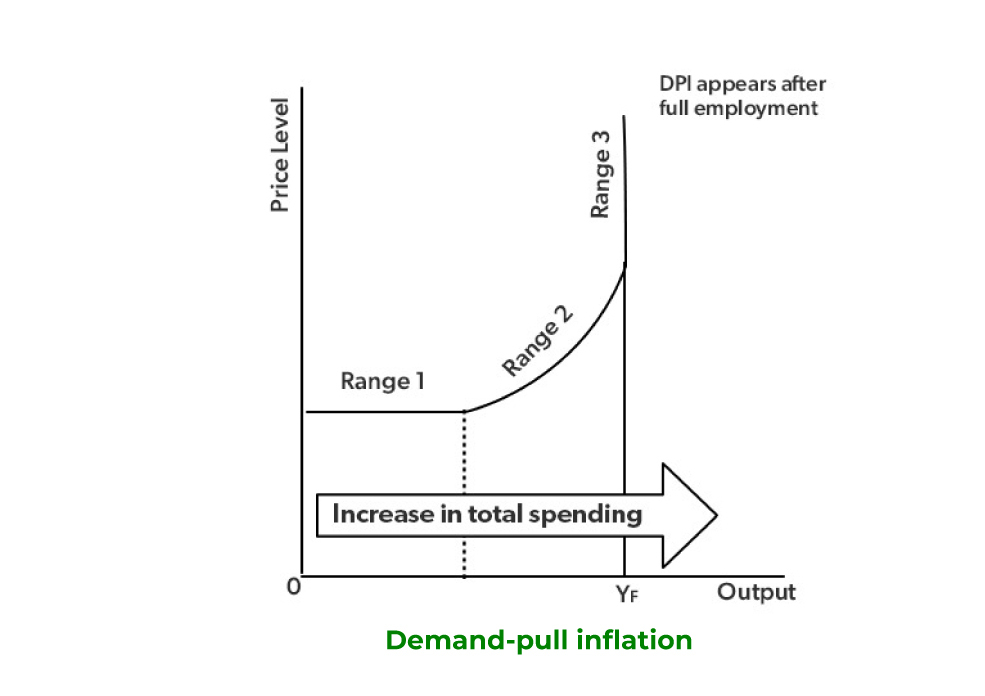
- Demand-Pull Inflation
When the money supply increases in the market the purchasing power of individuals also increases, thus leading to increases in demand and a shortage in the supply causing Demand-Pull inflation. Due to higher demand and less supply, the prices of goods get increased. Thus this gap between the demand and supply leads to Demand-Pull inflation.
Demand Pull Inflation
- Cost-Push Inflation
The Cost-push inflation is just contradictory to Demand-Pull inflation and this type of inflation occurs when the overall price of goods increases due to an increase in the cost of other commodities required in production like the machines, labour wages, etc. The increase in the production cost results in the rise of the value of the finished good.

Cost Push Inflation
- Built-in Inflation
Built-in inflation refers to the inflation that is existing and is expected that it will also continue in the future. As the fuel prices, labor wages, and cost of machines keep on increasing that results in an increase in the final value of the good. Thus built-in inflation is the expected inflation rate that’s going to rise by a significant percentage every year.

Built-in Inflation
How is Inflation Measured?
Inflation can be easily calculated with the help of the simple mathematical formula mentioned below.
Inflation rate (%) =(Final CPI Index Value/Initial CPI Value)*100
You need to know the CPI to calculate the inflation rate from the above formula. So, every household needs certain goods and services for their daily life and they have a certain budget for it according to their income. So, the government conducts the survey and measures the purchasing capacity of random households based on certain essential goods and compares the purchasing capacity of households in the present year with the last year. And this average is known as the Consumer Price Index (CPI). These goods and services mainly include food, transportation, and medical care.
What are the causes of inflation?
Inflation means there is a sustained increase in the price level. The main causes of inflation are either excess aggregate demand (AD) (economic growth too fast) or cost-push factors (supply-side factors).
Summary of the main causes of inflation
- Demand-pull inflation – aggregate demand growing faster than aggregate supply (growth too rapid)
- Cost-push inflation – For example, higher oil prices feeding through into higher costs.
- Devaluation – increasing cost of imported goods, and also the boost to domestic demand.
- Rising wages – higher wages increase firms costs and increase consumers’ disposable income to spend more.
- Expectations of inflation – High inflation expectations causes workers to demand wage increases and firms to push up prices.
1. Demand-pull inflation
If the economy is at or close to full employment, then an increase in aggregate demand (AD) leads to an increase in the price level (PL). As firms reach full capacity, they respond by putting up prices leading to inflation. Also, near full employment with labour shortages, workers can get higher wages which increase their spending power.

AD can increase due to an increase in any of its components C+I+G+X-M
We tend to get demand-pull inflation if economic growth is above the long-run trend rate of growth. The long-run trend rate of economic growth is the average sustainable rate of growth and is determined by the growth in productivity. Demand-pull inflation can be caused by factors such as
- Higher wages.
- Increased consumer confidence.
- Rising house prices – causing positive wealth effect.
Example of demand-pull inflation in the UK
 In the 1980s, the UK experienced rapid economic growth. The government cut interest rates and also cut taxes. House prices rose by up to 30% – impact a positive wealth effect and a rise in consumer confidence. This increased confidence led to higher spending, lower saving and an increase in borrowing. However, the rate of economic growth reached 5% a year – well above the UK’s long-run trend rate of 2.5 %. The result was a rise in inflation as firms could not meet demand. It also led to a current account deficit. You can read more about demand-pull inflation at the Lawson Boom of the 1980s.
2. Cost-push inflation
If there is an increase in the costs of firms, then businesses will pass this on to consumers. There will be a shift to the left in the SRAS.

1. Rising wages If trades unions can present a united front then they can bargain for higher wages. Rising wages are a key cause of cost-push inflation because wages are the most significant cost for many firms. (higher wages may also contribute to rising demand) See also wage-push inflation.
2. Import prices One-third of all goods are imported in the UK. If there is a devaluation, then import prices will become more expensive leading to an increase in inflation. A devaluation/depreciation means the Pound is worth less. Therefore we have to pay more to buy the same imported goods.

In 2011/12, the UK experienced a rise in cost-push inflation, partly due to the depreciation of the Pound against the Euro. (also due to higher taxes)
In 2022, the UK experienced more cost-push inflation due to rising oil, gas prices, Ukraine conflict, Brexit cost issues, depreciation in Pound, Covid supply constraints.
3. Raw material prices The best example is the price of oil. If the oil price increase by 20% then this will have a significant impact on most goods in the economy and this will lead to cost-push inflation. E.g., in 1974 there was a spike in the price of oil causing a period of high inflation around the world.
4. Higher inflation expectations
Once inflation sets in, it is difficult to reduce inflation. For example, higher prices will cause workers to demand higher wages causing a wage-price spiral. Therefore, expectations of inflation are important. If people expect high inflation, it tends to be self-fulfilling. When expectations are low, temporary rise in prices tend to be short-lived and fade away.
5. Printing more money
If the Central Bank prints more money, you would expect to see a rise in inflation. This is because the money supply plays an important role in determining prices. If there is more money chasing the same amount of goods, then prices will rise. Hyperinflation is usually caused by an extreme increase in the money supply.
However, in exceptional circumstances – such as liquidity trap/recession, it is possible to increase the money supply without causing inflation. This is because, in a recession, an increase in the money supply may just be saved, e.g. banks don’t increase lending but just keep more bank reserves.
6. Higher taxes
If the government put up taxes, such as VAT and Excise duty, this will lead to higher prices, and therefore CPI will increase. However, these tax rises are likely to be one-off increases. There is even a measure of inflation (CPI-CT) that ignores the effect of temporary tax rises/decreases.
7. Declining productivity
If firms become less productive and allow costs to rise, this invariably leads to higher prices.
8. Profit push inflation
When firms push up prices to get higher rates of inflation. This is more likely to occur during strong economic growth.
9. Monetary and fiscal policy
The attitude of the monetary authorities is important; for example, if there was an increase in AD and the monetary authorities accommodated this by increasing the money supply then there would be a rise in the price level.
Related
- Different types of inflation
- The link between devaluation and inflation
- Why printing money causes inflation
According to New
York (CNN Business) America is finishing the year with decades-high inflation.
That doesn't predict well for 2022.
Prices have gone so high it will take some
time for them to come back to their lesser intensities. In other words, the discomforting
inflation of 2021 will likely stay with us this whole year as well.
The most recent price data had proven two of
the most watched inflation measures — the consumer price index and
the personal consumption
expenditure index — each climbed to a 39-year high.
The latter index is what the Federal Reserve
pays the most attention to when assessing the nation's inflation.
There's some room for optimism: The central
bank, which is tasked with keeping prices stable, is rolling back its pandemic stimulus and
is expected to raise interest rates next year to tame inflation and stop the
economy from overheating.
And last month's data actually showed that
prices increased at a slower rate in November than in October for both
the CPI and the PCE indices. That's
good news, even though the slowdown was small at only 0.1 percentage points.
But here's the thing: Economists prefer to
look at price movements over a period of time, usually 12 months. So a small
slowdown like November's won't move the needle just yet.
In fact, it might take months for these
incremental slowdowns to show up in the data. After a year of prices soaring on
high demand and supply chain chaos, a lot of big numbers are baked into the
12-month data set. Even if inflation suddenly falls off a cliff, it would take
time for the leading indices to reflect that. This is what Fed Chair Jerome
Powell is talking about when he mentions "base effects."
Why will inflation remain high?
Several factors are keeping prices elevated.
One is the supply chain chaos that came to a
head last summer. Even though some bottlenecks have eased, the issues are not
fully resolved. And as long as it's more expensive — and takes more time — to
move goods around the world, higher transport costs will likely be passed down
to consumers.
Another big contributor is the high cost of
commodity prices, leading to surging energy and food costs. Prices in both
sectors have soared this year and added a good chunk to the inflation we have
already seen. In the case of food, high prices have forced some consumers to buy less
or switch stores.
Economists don't expect that to get any better
next year. Aside from high demand and shipping costs, rising prices for fertilizer and
continued bad weather could keep food prices high even as other
pandemic fueled inflation pressures ease.
Rising rents also remain a concern. This is
important because housing represents a big percentage of what people spend
money on. If rents eat up a bigger piece of the pie, consumers might wind up
spending less, which would be bad news for the recovery.
In November, rent rose 0.4% for the third
month in a row, according to economists at Bank of America, and that points to
higher and more persistent inflation going forward.
The "recent broadening of inflationary
pressure has coincided with a notable pickup in rental inflation," said
Peter B. McCrery, economist at JPMorgan, "which jumped to its highest
monthly rate in 20 years in the September CPI report and has stayed firm since
then."
And then there's Omicron.
Several countries, including the United States, have seen
record high Covid-19 infections in recent weeks because of the rapidly
spreading variant. If this leads to a new round of lockdowns, it could once
again change the way consumers spend and boost demand for stay-at-home goods.
Perhaps more importantly, Omicron could impact
energy prices: If restrictions return and people travel less, the
lowered energy demand would mean prices ease, and that would help bring
inflation back down.
Worldwide Inflation by Country 2022
It’s not just the United States that is suffering from high
inflation, countries worldwide are experiencing higher than average
inflation. This is partially due to the global pandemic but even more the
result of the actions taken by central banks in response to the pandemic. In
this article, we will look at global
inflation rates by country and inflation around the world.
The World Inflation Rate
The average inflation rate around the world is 7.4%. The global
inflation rate surged from 4.35% in 2021, and 3.18% in 2020.
Jump to:
·
Countries with the
Highest Inflation Rates
·
Countries with
Hyperinflation
·
African Inflation
Rate by Country
Countries with the Highest
Inflation Rates
The top countries with the highest inflation are the typical
group of suspects. The top ten have suffered from hyperinflation consistently
even when the rest of the world had very low inflation rates. As of this
writing, Sudan is the country with the highest inflation rate in the world at
260%. But we have to remember that these are the “official inflation rates” the
actual real-life inflation experienced by consumers could easily be much higher
or even double the official rate. The country with the second-worst inflation
rate in the world should also be no surprise… Venezuela. Apparently, as we
projected the Venezuelan foray into crypto
currency didn’t solve their inflation problem. Number 3 is Lebanon which is alsosuffering a repeat performance of hyperinflation. Syria has the 4th highestinflation in the world and we wrote about its hyperinflation back in 2013. Number
5 is Zimbabwe which has
suffered from the worst hyperinflation off and on this entire millennium.
Although it is well below the 2.2 million percent that it once
was.
Back in February, we wrote about the Massive Gap between
Official Turkish Inflation and Reality. We have to remember that as
Milton Friedman once said, “inflation is always and everywhere a monetary phenomenon”
Although below 10% inflation the relationship is weaker. But
governments consistently want to blame anything else besides their misguided
monetary policies for the advent of hyperinflation in their country.
Countries with Hyperinflation
Although it is difficult to say at what point high inflation
becomes “hyperinflation” we have listed the top 10 inflation countries as “countries with hyperinflation in
2022”. These countries all have inflation rates above 30%.
|
Country |
Inflation Rate |
Reference Date |
|
Venezuela |
500% |
September
2022 |
|
sudan |
273% |
September2022 |
|
Lebanon |
180% |
September
2022 |
|
Syria |
139.46% |
September
2022 |
|
Zimbabwe |
98.5% |
September2022 |
|
Turkey |
69.97% |
April 2022 |
|
Suriname |
61.5% |
January 2022 |
|
Argentina |
58% |
April 2022 |
|
Ethiopia |
36.6% |
April 2022 |
|
Iran |
35.6% |
April 2022 |
The second tier of high inflation countries includes Russia
which shouldn’t be a surprise since countries typically experience high
inflation during times of war since they tend to print money to finance their
conquests. But these inflation numbers are from April so we can expect Russia
to move up the inflation ladder in the weeks and months ahead as Sanctions against Russia have a greater
effect.
|
Country |
Inflation Rate |
Reference Date |
|
Sri Lanka |
29.8% |
April 2022 |
|
Moldova |
27.1% |
April 2022 |
|
Angola |
25.79% |
April 2022 |
|
Haiti |
23.95% |
January 2022 |
|
Ghana |
23.6% |
April 2022 |
|
Cuba |
23.3% |
January 2022 |
|
Estonia |
18.8% |
January 2022 |
|
Russia |
17.8% |
April 2022 |
|
Sierra Leone |
17.59% |
February
2022 |
|
Nigeria |
16.82% |
April 2022 |
Inflation in Europe
European inflation has been on the upswing like most of the rest
of the world in 2022. The worst European inflation occurred in (as we’ve
already mentioned) Turkey, Moldova, Estonia, and Russia. Although Lichtenstein
appears last on this list, it is important to note that its numbers are from
December, when the whole world had lower inflation rates. It is also
interesting to note that in April Great Britain aka. The United Kingdom at 9%
has a higher annual inflation rate than the United States at 8.3%. Due to its
strict fiscal monetary stance, the Swiss
inflation rate is still it's typical 2.5%, however.
|
COUNTRY |
INFLATION RATE |
REFERENCE DATE |
|
Turkey |
69.97% |
Apr/22 |
|
Moldova |
27.1% |
Apr/22 |
|
Estonia |
18.8% |
Apr/22 |
|
Russia |
17.8% |
Apr/22 |
|
Belarus |
16.8% |
Apr/22 |
|
Lithuania |
16.8% |
Apr/22 |
|
Ukraine |
16.4% |
Apr/22 |
|
Bulgaria |
14.4% |
Apr/22 |
|
Czech
Republic |
14.2% |
Apr/22 |
|
Romania |
13.76% |
Apr/22 |
|
Latvia |
13% |
Apr/22 |
|
Poland |
12.4% |
Apr/22 |
|
Slovakia |
11.8% |
Apr/22 |
|
Kosovo |
11.2% |
Apr/22 |
|
Montenegro |
11.2% |
Apr/22 |
|
Macedonia |
10.5% |
Apr/22 |
|
Bosnia and
Herzegovina |
10.2% |
Mar/22 |
|
Greece |
10.2% |
Apr/22 |
|
Netherlands |
9.6% |
Apr/22 |
|
Serbia |
9.6% |
Apr/22 |
|
Hungary |
9.5% |
Apr/22 |
|
Croatia |
9.4% |
Apr/22 |
|
United
Kingdom |
9% |
Apr/22 |
|
Cyprus |
8.8% |
Apr/22 |
|
Belgium |
8.31% |
Apr/22 |
|
Spain |
8.3% |
Apr/22 |
|
European
Union |
8.1% |
Apr/22 |
|
Euro Area |
7.4% |
Apr/22 |
|
Germany |
7.4% |
Apr/22 |
|
Austria |
7.2% |
Apr/22 |
|
Iceland |
7.2% |
Apr/22 |
|
Portugal |
7.2% |
Apr/22 |
|
Ireland |
7% |
Apr/22 |
|
Luxembourg |
7% |
Apr/22 |
|
Slovenia |
6.9% |
Apr/22 |
|
Denmark |
6.7% |
Apr/22 |
|
Sweden |
6.4% |
Apr/22 |
|
Albania |
6.2% |
Apr/22 |
|
Italy |
6% |
Apr/22 |
|
Finland |
5.7% |
Apr/22 |
|
Malta |
5.4% |
Apr/22 |
|
Norway |
5.4% |
Apr/22 |
|
France |
4.8% |
Apr/22 |
|
Faroe
Islands |
4.4% |
Mar/22 |
|
Switzerland |
2.5% |
Apr/22 |
|
Liechtenstein |
1.5% |
Dec/21 |
EU Inflation Rate aka. European Inflation Rate
The European Union (EU) inflation rate is 7.4%. If, as we’ve
already said, inflation is a monetary phenomenon, how can various EU countries
have different inflation rates? According to the European Central Bank (ECB) “The euro area economies have
experienced a considerable degree of inflation rate convergence during the
past decade.” So having the same Central Bank has tended
to stabilize the individual European country’s inflation rates. But each
country still has control over its own spending, borrowing, and taxation
policies but they can’t set their own interest rates, which creates stresses
within the EU financial system. It is also important to note that NOT all EU Countries use the EURO
so they may not even have the same currency.
Looking at individual European debt to GDP ratios we see that
Greece is the highest at 193%, Germany is in the middle at 69.3%, and
Estonia is the lowest at 18.1%.
|
Country |
Uses the
Euro |
Inflation
Rate |
Debt/GDP % |
|
Austria |
Yes |
7.20% |
82.80% |
|
Belgium |
Yes |
8.31% |
108.00% |
|
Cyprus |
Yes |
8.80% |
104.00% |
|
Estonia |
Yes |
18.80% |
18.10% |
|
Finland |
Yes |
5.70% |
65.80% |
|
France |
Yes |
4.80% |
113.00% |
|
Germany |
Yes |
7.40% |
69.30% |
|
Greece |
Yes |
10.20% |
193.00% |
|
Ireland |
Yes |
7.00% |
56.00% |
|
Italy |
Yes |
6.00% |
151.00% |
|
Latvia |
Yes |
13.00% |
44.80% |
|
Lithuania |
Yes |
16.80% |
44.30% |
|
Luxembourg |
Yes |
7.00% |
24.40% |
|
Malta |
Yes |
5.40% |
57.00% |
|
Netherlands |
Yes |
9.60% |
52.10% |
|
Portugal |
Yes |
7.20% |
127.00% |
|
Slovakia |
Yes |
11.80% |
63.10% |
|
Slovenia |
Yes |
6.90% |
74.70% |
|
Spain |
Yes |
8.30% |
118.00% |
|
Bulgaria |
No |
14.40% |
21.10% |
|
Croatia |
No |
9.40% |
79.80% |
|
Czech
Republic |
No |
14.20% |
41.90% |
|
Denmark |
No |
6.70% |
36.70% |
|
Hungary |
No |
9.50% |
76.80% |
|
Poland |
No |
12.40% |
53.80% |
|
Romania |
No |
13.76% |
48.80% |
|
Sweden |
No |
6.40% |
36.70% |
Inflation in China
Chinese inflation is one of the lowest inflation rates in the
world at 2.1% as of April 2022. However, like in many other countries, the
official China Inflation Rate may not represent real-life inflation i.e., what
actual Chinese consumers pay. Some of China’s neighbors on the other hand still
have very high inflation, especially the “Stan countries”. Kyrgyzstan
14.5%, Pakistan 13.4%, Kazakhstan 13.2%, Turkmenistan 12.45%, and Uzbekistan
10.38%. Inflation for other Chinese neighbors includes Mongolia at 14.4%,
Georgia at 12.8%, and Myanmar at 12.63%.
Other Asian Inflation Rates
The Philippine inflation rate is relatively moderate at 4.9%,
South Korea has 4.8%, and Thailand has 4.65%. At the lower end of the inflation
scale, Japan has a national inflation rate of only 2.5%, Vietnam has 2.64%,
Malaysia has 2.2%, and Hong Kong has 1.7%.
Countries with the Lowest
Inflation
South Sudan (not to be confused with Sudan) had massive
deflation with prices actually falling by -8.52% over the year. Bolivia had less than 1% annual inflation
and the Maldives and Macau had just over 1% inflation. But beware, many of the
low inflation countries on this list haven’t reported since last December (or
earlier) so their actual inflation rate could be much higher by now.
|
COUNTRY |
LAST |
REFERENCE |
|
South Sudan |
-8.52 |
December
2021 |
|
Bolivia |
0.87 |
April 2022 |
|
Vanuatu |
0.9 |
September
2021 |
|
Maldives |
1.05 |
March 2022 |
|
Macau |
1.07 |
March 2022 |
|
New
Caledonia |
1.2 |
December
2021 |
|
Liechtenstein |
1.5 |
December
2021 |
|
Afghanistan |
1.56 |
June 2021 |
|
Hong Kong |
1.7 |
March 2022 |
|
Benin |
2 |
April 2022 |
|
China |
2.1 |
April 2022 |
|
Brunei |
2.2 |
December
2021 |
|
Malaysia |
2.2 |
March 2022 |
|
Seychelles |
2.2 |
April 2022 |
|
Saudi Arabia |
2.3 |
April 2022 |
|
Cameroon |
2.37 |
September
2021 |
|
Bermuda |
2.5 |
February
2022 |
|
Japan |
2.5 |
April 2022 |
|
Switzerland |
2.5 |
April 2022 |
|
United Arab
Emirates |
2.5 |
December
2021 |
|
Eritrea |
2.6 |
December
2021 |
|
Vietnam |
2.64 |
April 2022 |
|
Oman |
2.67 |
April 2022 |
|
Central
African Republic |
2.7 |
December
2021 |
|
Ecuador |
2.89 |
April 2022 |
|
Equatorial
Guinea |
2.9 |
December
2021 |
|
Gabon |
2.9 |
March 2022 |
|
Swaziland |
3.3 |
February
2022 |
|
3.38 |
April 2022 |
|
|
3.47 |
April 2022 |
African Inflation Rate by
Country
As we showed above, many of the highest inflation countries are
in Africa including Sudan, Zimbabwe, and Ethiopia. South African inflation is
pretty much middle of the road at 5.9%.
|
COUNTRY |
LAST |
REFERENCE |
|
Sudan |
260% |
January 2022 |
|
Zimbabwe |
96.4% |
April 2022 |
|
Ethiopia |
36.6% |
April 2022 |
|
Angola |
25.79% |
April 2022 |
|
Ghana |
23.6% |
April 2022 |
|
Sierra Leone |
17.59% |
February
2022 |
|
Nigeria |
16.82% |
April 2022 |
|
Burundi |
16.09% |
April 2022 |
|
Malawi |
15.7% |
April 2022 |
|
Burkina Faso |
15.1% |
April 2022 |
|
Egypt |
13.1% |
April 2022 |
|
Guinea |
12.42% |
March 2022 |
|
Sao Tome and
Principe |
12.1% |
February
2022 |
|
Gambia |
11.69% |
April 2022 |
|
Zambia |
11.5% |
April 2022 |
|
Mauritius |
11% |
April 2022 |
|
Rwanda |
10.5% |
April 2022 |
|
Algeria |
9.6% |
February
2022 |
|
Botswana |
9.6% |
April 2022 |
|
Mozambique |
7.9% |
April 2022 |
|
Cape Verde |
7.6% |
April 2022 |
|
Togo |
7.5% |
April 2022 |
|
Tunisia |
7.5% |
April 2022 |
|
Lesotho |
7.2% |
March 2022 |
|
Guinea
Bissau |
6.5% |
January 2022 |
|
Somalia |
6.5% |
April 2022 |
|
Kenya |
6.47% |
April 2022 |
|
Madagascar |
6.34% |
February
2022 |
|
Senegal |
6.2% |
March 2022 |
|
Mauritania |
6.1% |
February
2022 |
|
Morocco |
5.9% |
April 2022 |
|
South Africa |
5.9% |
April 2022 |
|
Libya |
5.7% |
March 2022 |
|
Namibia |
5.6% |
April 2022 |
|
Liberia |
5.44% |
November
2021 |
|
Uganda |
4.9% |
April 2022 |
|
Niger |
4.89% |
December
2021 |
|
Ivory Coast |
4.5% |
March 2022 |
|
Mali |
4.5% |
January 2022 |
|
Congo |
3.99% |
November
2021 |
|
Tanzania |
3.8% |
April 2022 |
|
Djibouti |
3.61% |
March 2022 |
|
Comoros |
3.59% |
September
2021 |
|
Chad |
3.5% |
March 2022 |
|
Swaziland |
3.3% |
February
2022 |
|
Equatorial
Guinea |
2.9% |
December
2021 |
|
Gabon |
2.9% |
March 2022 |
|
Central
African Republic |
2.7% |
December 2021 |
|
Eritrea |
2.6% |
December
2021 |
|
Cameroon |
2.37% |
September
2021 |
|
Seychelles |
2.2% |
April 2022 |
|
Benin |
2% |
April 2022 |
|
South Sudan |
-8.52% |
December
2021 |
Articles Linked Above:
·
Can Crypto Solve
Venezuela’s Hyperinflation?
·
Hyperinflation
strikes Lebanon… Again
·
Zimbabwe Inflation
2.2 million Percent
·
Zimbabwe Switches to
the U.S. Dollar
·
Hyperinflation in
Turkey and Argentina Today
World Inflation Data Courtesy of Trading Economics where you can
view the full list of Nations and their inflation rates.

Comments